Note
Click here to download the full example code
GONG PFSS extrapolation
Calculating PFSS solution for a GONG synoptic magnetic field map.
First, import required modules
import os
import astropy.constants as const
import matplotlib.pyplot as plt
from mpl_toolkits.mplot3d import Axes3D
import numpy as np
import pfsspy
import sunpy.map
If a gong magnetic field map isn’t present, download one
if not os.path.exists('gong.fits') and not os.path.exists('gong.fits.gz'):
    import urllib.request
    urllib.request.urlretrieve(
        'https://gong2.nso.edu/oQR/zqs/201901/mrzqs190108/mrzqs190108t1114c2212_050.fits.gz',
        'gong.fits.gz')

if not os.path.exists('gong.fits'):
    import gzip
    with gzip.open('gong.fits.gz', 'rb') as f:
        with open('gong.fits', 'wb') as g:
            g.write(f.read())
Use SunPy to read the .fits file with the data
map = sunpy.map.Map('gong.fits')
nr = 60
rss = 2.5
Extract the data, and remove the mean to enforce div(B) = 0 on the solar surface
br = map.data
br = br - np.mean(br)
Create PFSS input object
input = pfsspy.Input(br, nr, rss)
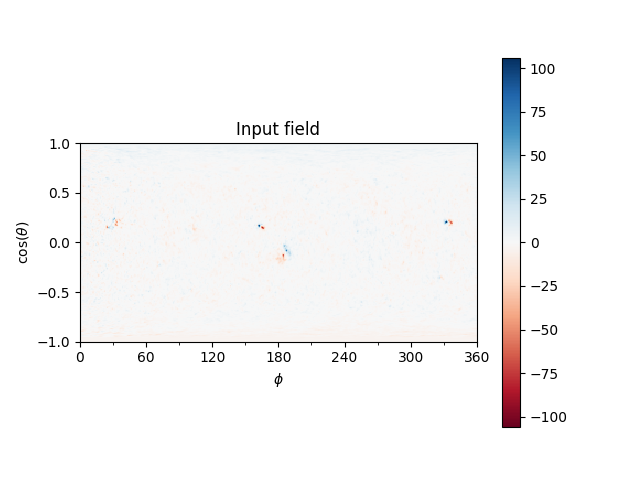
Plot input magnetic field
fig, ax = plt.subplots()
mesh = input.plot_input(ax)
fig.colorbar(mesh)
ax.set_title('Input field')
Calculate PFSS solution
output = pfsspy.pfss(input)
output.plot_pil(ax)
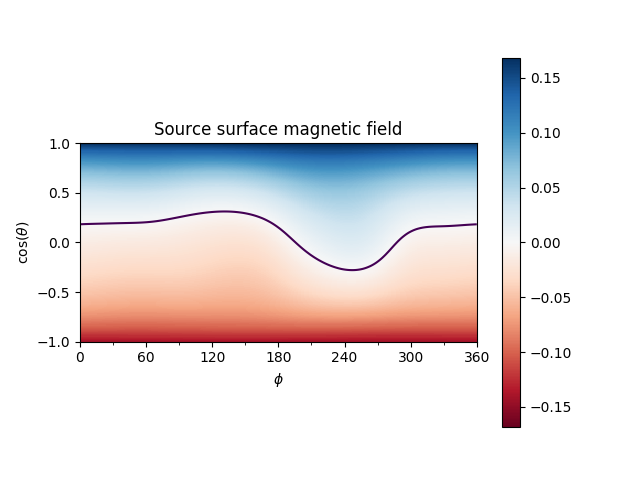
Plot output field
fig, ax = plt.subplots()
mesh = output.plot_source_surface(ax)
fig.colorbar(mesh)
output.plot_pil(ax)
ax.set_title('Source surface magnetic field')
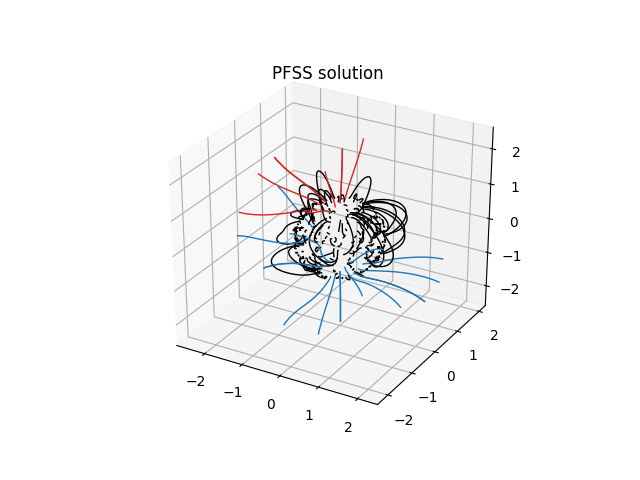
Trace some field lines
br, btheta, bphi = output.bg

fig = plt.figure()
ax = fig.add_subplot(111, projection='3d')
ax.set_aspect('equal')

# Loop through 16 values in theta and 16 values in phi
r = 1.01
for theta in np.linspace(0, np.pi, 17):
    for phi in np.linspace(0, 2 * np.pi, 17):
        x0 = np.array([r * np.cos(phi),
                       r * np.sin(theta) * np.sin(phi),
                       r * np.cos(theta) * np.sin(phi)])
        field_line = output.trace(x0)
        color = {0: 'black', -1: 'tab:blue', 1: 'tab:red'}.get(field_line.polarity)
        ax.plot(field_line.x / const.R_sun,
                field_line.y / const.R_sun,
                field_line.z / const.R_sun,
                color=color, linewidth=1)

# Add inner and outer boundary circles
ax.set_title('PFSS solution')
plt.show()

# sphinx_gallery_thumbnail_number = 3
Total running time of the script: ( 0 minutes 26.434 seconds)