Note
Click here to download the full example code
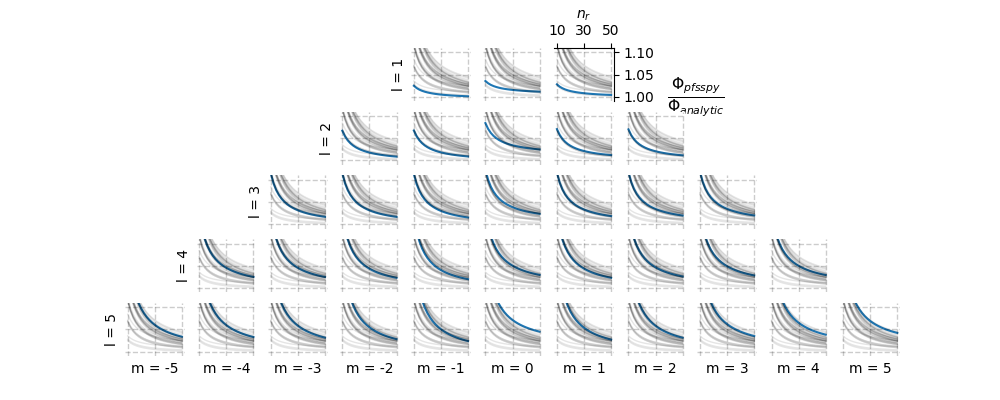
Open flux and radial grid points
The script visualises results from open_flux_harmonics.py.
It shows the ratio of numeric to analytic total unsigned open fluxes in PFSS
solutions of spherical harmonics, as a function of the number of radial grid
cells in the pfsspy grid.
import matplotlib.pyplot as plt
import matplotlib.ticker as mticker
import pandas as pd

from helpers import LMAxes, result_dir

df = pd.read_csv(result_dir / 'open_flux_results.csv', index_col=0)
axs = LMAxes(nl=5)

for lm in df.columns:
    l = int(lm[0])
    m = int(lm[1:])
    ax = axs[l, m]
    ax.plot(df.index, df[lm])

    for lm1 in df.columns:
        if lm1 != lm:
            ax.plot(df.index, df[lm1], linewidth=1, alpha=0.1, color='black')

    for x in [10, 30, 50]:
        ax.axvline(x, color='black', linestyle='--', linewidth=1, alpha=0.2)
    for y in [1, 1.05, 1.1]:
        ax.axhline(y, color='black', linestyle='--', linewidth=1, alpha=0.2)
    ax.set_ylim(0.99, 1.11)

    if l == 1 and m == 1:
        ax.xaxis.set_ticks([10, 30, 50])
        ax.xaxis.tick_top()
        ax.set_xlabel(r'$n_{r}$')
        ax.xaxis.set_label_position('top')
        ax.xaxis.set_major_formatter(mticker.ScalarFormatter())

        ax.yaxis.set_ticks([1, 1.05, 1.1])
        ax.yaxis.tick_right()
        ax.set_ylabel(r'$\frac{\Phi_{pfsspy}}{\Phi_{analytic}}$',
                      rotation=0, labelpad=30, fontsize=16, loc='center')
        ax.yaxis.set_label_position('right')
        ax.yaxis.set_major_formatter(mticker.ScalarFormatter())

        ax.spines['top'].set_visible(True)
        ax.spines['right'].set_visible(True)

plt.show()
Total running time of the script: ( 0 minutes 12.964 seconds)