Note
Click here to download the full example code
Magnetic field along a field line
How to get the value of the magnetic field along a field line traced through the PFSS solution.
import astropy.constants as const
import astropy.units as u
import matplotlib.pyplot as plt
import sunpy.map
from astropy.coordinates import SkyCoord

import pfsspy
from pfsspy import tracing
from pfsspy.sample_data import get_gong_map
Load a GONG magnetic field map
gong_fname = get_gong_map()
gong_map = sunpy.map.Map(gong_fname)
Out:
Files Downloaded:   0%|          | 0/1 [00:00<?, ?file/s]

pfsspy.mrzqs200901t1304c2234_022.fits.gz:   0%|          | 0.00/242k [00:00<?, ?B/s]

pfsspy.mrzqs200901t1304c2234_022.fits.gz:   0%|          | 100/242k [00:00<06:52, 586B/s]


Files Downloaded: 100%|##########| 1/1 [00:00<00:00,  2.31file/s]
Files Downloaded: 100%|##########| 1/1 [00:00<00:00,  2.31file/s]
The PFSS solution is calculated on a regular 3D grid in (phi, s, rho), where rho = ln(r), and r is the standard spherical radial coordinate. We need to define the number of rho grid points, and the source surface radius.
nrho = 35
rss = 2.5
From the boundary condition, number of radial grid points, and source surface, we now construct an Input object that stores this information
pfss_in = pfsspy.Input(gong_map, nrho, rss)
pfss_out = pfsspy.pfss(pfss_in)
Now take a seed point, and trace a magnetic field line through the PFSS solution from this point
tracer = tracing.FortranTracer()
r = 1.2 * const.R_sun
lat = 70 * u.deg
lon = 0 * u.deg

seeds = SkyCoord(lon, lat, r, frame=pfss_out.coordinate_frame)
field_lines = tracer.trace(seeds, pfss_out)
Out:
INFO: Missing metadata for solar radius: assuming the standard radius of the photosphere. [sunpy.map.mapbase]
INFO: Missing metadata for solar radius: assuming the standard radius of the photosphere. [sunpy.map.mapbase]
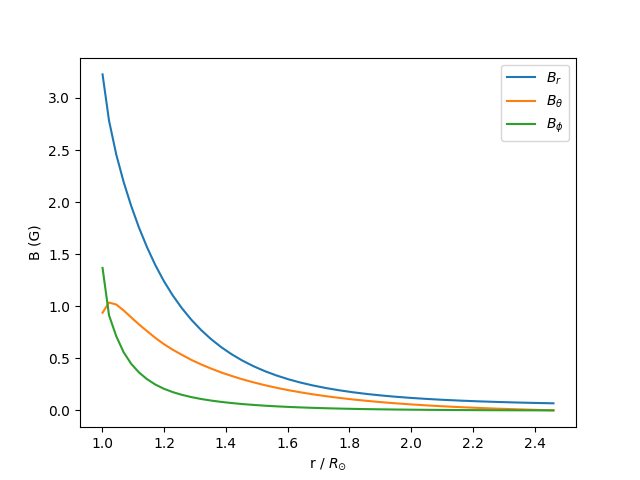
From this field line we can extract the coordinates, and then use
.b_along_fline to get the components of the magnetic field along the
field line.
From the plot we can see that the non-radial component of the mangetic field goes to zero at the source surface, as expected.
field_line = field_lines[0]
B = field_line.b_along_fline
r = field_line.coords.radius
fig, ax = plt.subplots()

ax.plot(r.to(const.R_sun), B[:, 0], label=r'$B_{r}$')
ax.plot(r.to(const.R_sun), B[:, 1], label=r'$B_{\theta}$')
ax.plot(r.to(const.R_sun), B[:, 2], label=r'$B_{\phi}$')
ax.legend()
ax.set_xlabel(r'r / $R_{\odot}$')
ax.set_ylabel(f'B ({B.unit})')

plt.show()
Total running time of the script: ( 0 minutes 5.283 seconds)