Note
Click here to download the full example code
Overplotting field lines on AIA maps
This example shows how to take a PFSS solution, trace some field lines, and overplot the traced field lines on an AIA 193 map.
First, we import the required modules
from datetime import datetime
import os

import astropy.units as u
import matplotlib.pyplot as plt
import numpy as np
import sunpy.map
import sunpy.io.fits

import pfsspy
import pfsspy.coords as coords
Load a GONG magnetic field map. The map date is 10/03/2019
if not os.path.exists('190310t0014gong.fits') and not os.path.exists('190310t0014gong.fits.gz'):
    import urllib.request
    urllib.request.urlretrieve(
        'https://gong2.nso.edu/oQR/zqs/201903/mrzqs190310/mrzqs190310t0014c2215_333.fits.gz',
        '190310t0014gong.fits.gz')

if not os.path.exists('190310t0014gong.fits'):
    import gzip
    with gzip.open('190310t0014gong.fits.gz', 'rb') as f:
        with open('190310t0014gong.fits', 'wb') as g:
            g.write(f.read())
Load the corresponding AIA 193 map
if not os.path.exists('AIA20190310.fits'):
    import urllib.request
    urllib.request.urlretrieve(
        'http://jsoc2.stanford.edu/data/aia/synoptic/2019/03/10/H0000/AIA20190310_0000_0193.fits',
        'AIA20190310.fits')

aia = sunpy.map.Map('AIA20190310.fits')
dtime = aia.date
We can now use SunPy to load the GONG fits file, and extract the magnetic field data.
The mean is subtracted to enforce div(B) = 0 on the solar surface: n.b. it is not obvious this is the correct way to do this, so use the following lines at your own risk!
[[br, header]] = sunpy.io.fits.read('190310t0014gong.fits')
br = br - np.mean(br)
GONG maps have their LH edge at -180deg in Carrington Longitude, so roll to get it at 0deg. This way the input magnetic field is in a Carrington frame of reference, which matters later when lining the field lines up with the AIA image.
br = np.roll(br, header['CRVAL1'] + 180, axis=1)
The PFSS solution is calculated on a regular 3D grid in (phi, s, rho), where rho = ln(r), and r is the standard spherical radial coordinate. We need to define the number of grid points in rho, and the source surface radius.
nrho = 60
rss = 2.5
From the boundary condition, number of radial grid points, and source surface, we now construct an Input object that stores this information
input = pfsspy.Input(br, nrho, rss, dtime=dtime)
Using the Input object, plot the input photospheric magnetic field
fig, ax = plt.subplots()
mesh = input.plot_input(ax)
fig.colorbar(mesh)
ax.set_title('Input field')
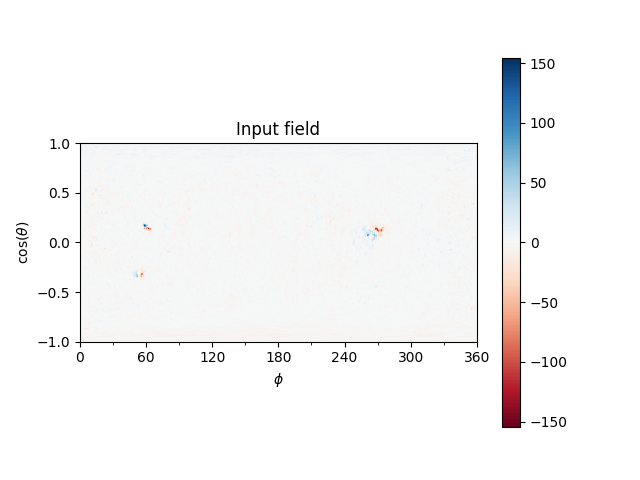
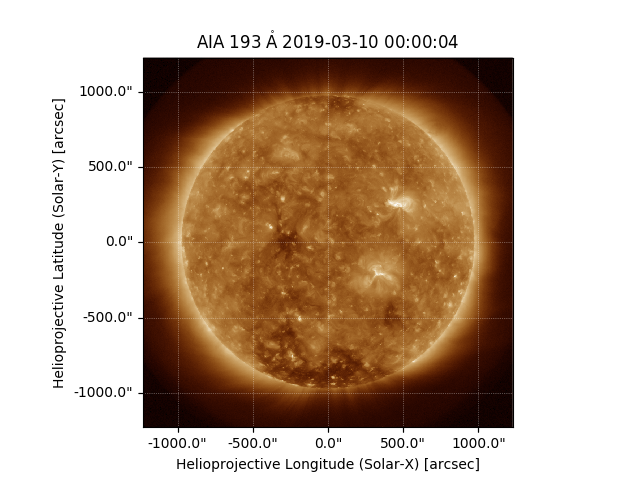
We can also plot the AIA map to give an idea of the global picture. There is a nice active region in the top right of the AIA plot, that can also be seen in the top left of the photospheric field plot above.
ax = plt.subplot(1, 1, 1, projection=aia)
aia.plot(ax)
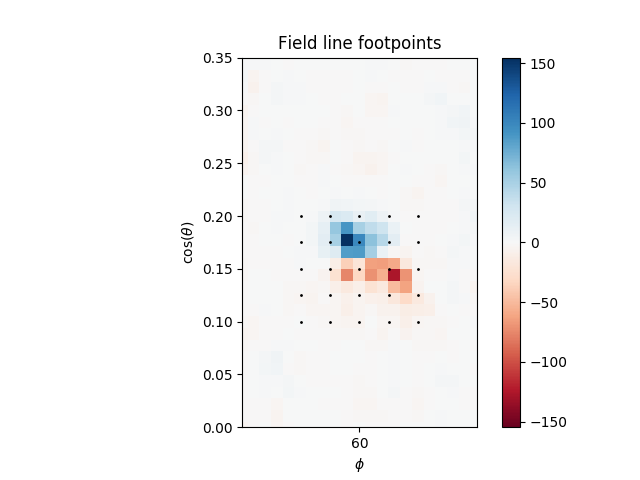
Now we construct a 10 x 10 grid of footpoitns to trace some magnetic field lines from.
The figure shows a zoom in of the magnetic field map, with the footpoints overplotted. The footpoints are centered around the active region metnioned above.
s, phi = np.meshgrid(np.linspace(0.1, 0.2, 5),
                     np.deg2rad(np.linspace(55, 65, 5)))

fig, ax = plt.subplots()
mesh = input.plot_input(ax)
fig.colorbar(mesh)
ax.scatter(np.rad2deg(phi), s, color='k', s=1)

ax.set_xlim(50, 70)
ax.set_ylim(0, 0.35)
ax.set_title('Field line footpoints')
Compute the PFSS solution from the GONG magnetic field input
output = pfsspy.pfss(input)
Trace field lines from the footpoints defined above. pfsspy.coords
is used to convert the s, phi cooridnates into the cartesian coordinates that
are needed by the tracer.
flines = []
for s, phi in zip(s.ravel(), phi.ravel()):
    x0 = np.array(pfsspy.coords.strum2cart(0.01, s, phi))
    flines.append(output.trace(x0, atol=1e-8))
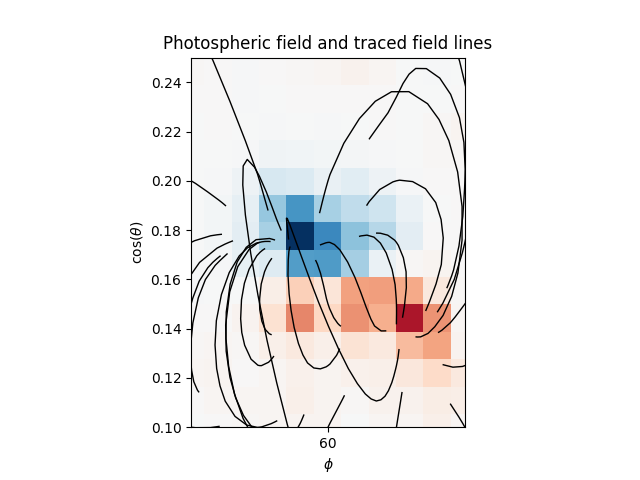
Plot the input GONG magnetic field map, along with the traced mangetic field lines.
fig, ax = plt.subplots()
mesh = input.plot_input(ax)
for fline in flines:
    fline.representation_type = 'spherical'
    ax.plot(fline.lon / u.deg, np.sin(fline.lat), color='black', linewidth=1)

ax.set_xlim(55, 65)
ax.set_ylim(0.1, 0.25)
ax.set_title('Photospheric field and traced field lines')
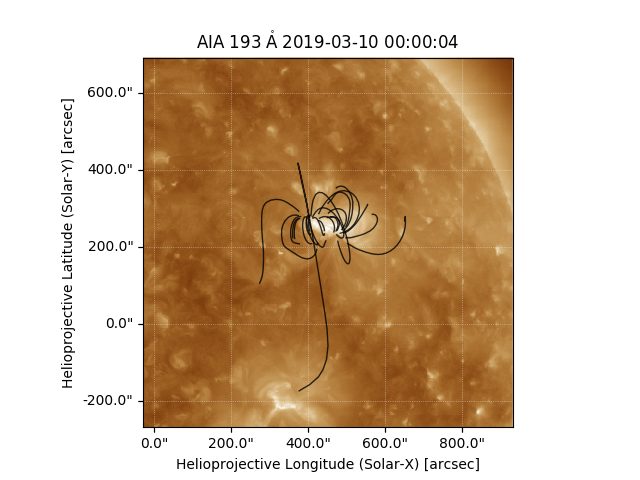
Plot the AIA map, along with the traced magnetic field lines. Inside the loop the field lines are converted to the AIA observer coordinate frame, and then plotted on top of the map.
fig = plt.figure()
ax = plt.subplot(1, 1, 1, projection=aia)
transform = ax.get_transform('world')
aia.plot(ax)
for fline in flines:
    fline = fline.transform_to(aia.coordinate_frame)
    Tx = fline.Tx.to(u.deg)
    Ty = fline.Ty.to(u.deg)
    ax.plot(Tx, Ty, transform=transform,
            alpha=0.8, linewidth=1, color='black')

ax.set_xlim(500, 900)
ax.set_ylim(400, 800)
plt.show()

# sphinx_gallery_thumbnail_number = 5
Total running time of the script: ( 0 minutes 10.290 seconds)