Note
Click here to download the full example code
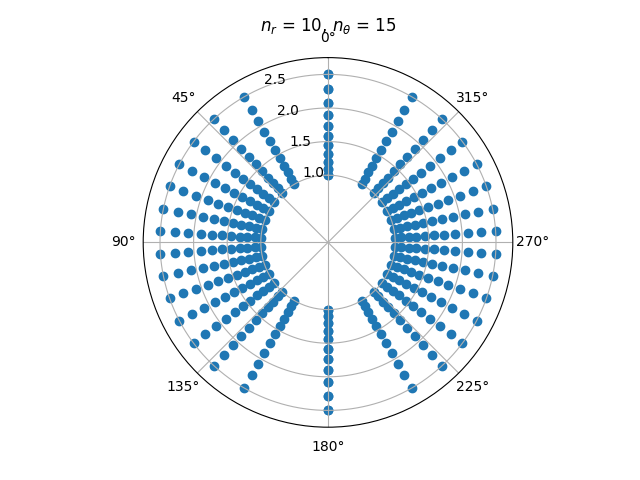
pfsspy magnetic field grid
A plot of the grid corners, from which the magnetic field values are taken when tracing magnetic field lines.
Notice how the spacing becomes larger at the poles, and closer to the source surface. This is because the grid is equally spaced in \(\cos \theta\) and \(\log r\).
import numpy as np
import matplotlib.pyplot as plt
from pfsspy import Grid
Define the grid spacings
ns = 15
nphi = 360
nr = 10
rss = 2.5
Create the grid
grid = Grid(ns, nphi, nr, rss)
Get the grid edges, and transform to r and theta coordinates
r_edges = np.exp(grid.rg)
theta_edges = np.arccos(grid.sg)
The corners of the grid are where lines of constant (r, theta) intersect, so meshgrid these together to get all the grid corners.
r_grid_points, theta_grid_points = np.meshgrid(r_edges, theta_edges)
Plot the resulting grid corners
fig = plt.figure()
ax = fig.add_subplot(projection='polar')

ax.scatter(theta_grid_points, r_grid_points)
ax.scatter(theta_grid_points + np.pi, r_grid_points, color='C0')

ax.set_ylim(0, 1.1 * rss)
ax.set_theta_zero_location('N')
ax.set_yticks([1, 1.5, 2, 2.5], minor=False)
ax.set_title('$n_{r}$ = ' f'{nr}, ' r'$n_{\theta}$ = ' f'{ns}')

plt.show()
Total running time of the script: ( 0 minutes 0.492 seconds)