Note
Click here to download the full example code
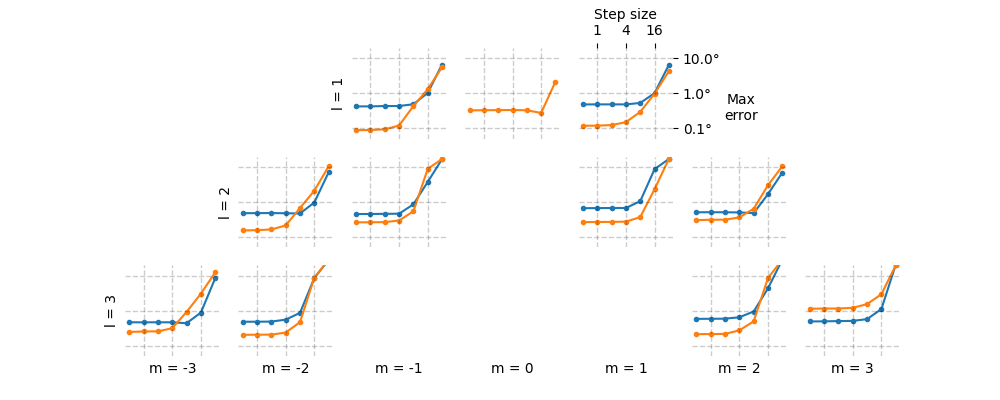
Tracer step size
Out:
1 -1
1 0
1 1
2 -2
2 -1
❌ Files not found for l=2, m=0
2 1
2 2
3 -3
3 -2
❌ Files not found for l=3, m=-1
❌ Files not found for l=3, m=0
❌ Files not found for l=3, m=1
3 2
3 3
import matplotlib.pyplot as plt
import matplotlib.ticker as mticker
import pandas as pd

from helpers import LMAxes, result_dir

nl = 3

axs = LMAxes(nl=nl)

for l in range(1, nl+1):
    for m in range(-l, l+1):
        ax = axs[l, m]
        try:
            dphis = pd.read_csv(result_dir / f'flines/dphis_{l}{m}.csv',
                                header=None, index_col=0)
            dthetas = pd.read_csv(result_dir / f'flines/dthetas_{l}{m}.csv',
                                  header=None, index_col=0)
            print(l, m)
        except FileNotFoundError:
            print(f'❌ Files not found for l={l}, m={m}')
            continue

        for data in [dphis, dthetas]:
            ax.plot(data.index, data.values, marker='.')

        ax.set_xscale('log')
        ax.set_yscale('log')
        ax.set_ylim(0.5e-1, 2e1)
        for x in [1, 4, 16]:
            ax.axvline(x, color='k', linewidth=1, linestyle='--', alpha=0.2)
        for y in [1e-1, 1, 1e1]:
            ax.axhline(y, color='k', linewidth=1, linestyle='--', alpha=0.2)

        if l == 1 and m == 1:
            ax.xaxis.tick_top()
            ax.yaxis.tick_right()
            ax.xaxis.set_ticks([1, 4, 16])
            ax.xaxis.set_major_formatter(mticker.ScalarFormatter())
            ax.yaxis.set_major_formatter(mticker.StrMethodFormatter('{x}°'))
            ax.xaxis.set_ticks([], minor=True)
            ax.yaxis.set_ticks([], minor=True)
            ax.set_xlabel('Step size')
            ax.set_ylabel('Max\nerror', rotation=0, labelpad=15, va='center')
            ax.xaxis.set_label_position('top')
            ax.yaxis.set_label_position('right')
        else:
            ax.yaxis.set_major_formatter(mticker.NullFormatter())
            for minor in [True, False]:
                ax.xaxis.set_ticks([], minor=minor)
                ax.yaxis.set_ticks([], minor=minor)


plt.show()
Total running time of the script: ( 0 minutes 0.778 seconds)